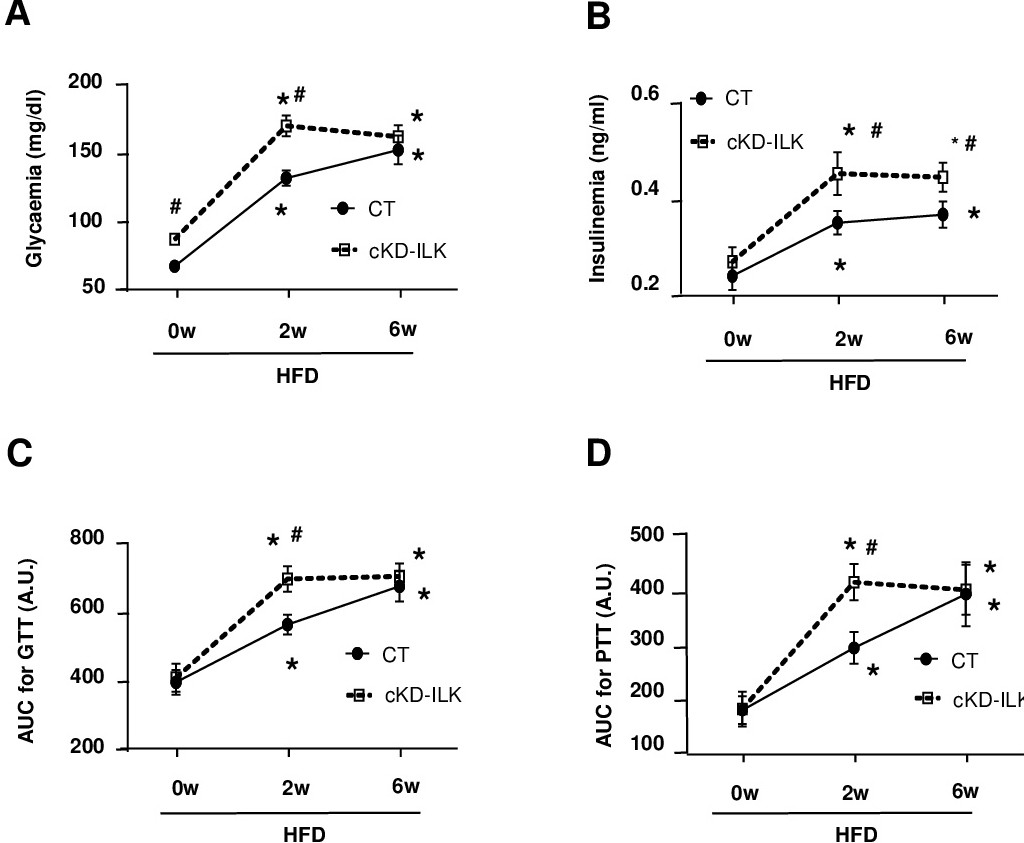
Fig. 1. Systemic glucose homeostasis and insulin sensitivity in CT and cKD-ILK along 6 weeks of HFD challenge. Blood glucose (A) and insulin (B) levels determined after fasting conditions from CT and cKD-ILK with HFD at time points 0, 2 and 6 weeks (w). Blood glucose levels during intraperitoneal glucose tolerance test (GTT) (C), and pyruvate tolerance test (PTT) (D), expressed as the areas under the curve (AUC). N=12 per group. All data are represented as means ± SEMs. *= P<0.05 vs 0w; #=P<0.05 vs CT at the same time point.